
The Average Is Nobody's Result
Of 255 studies on AI-assisted colonoscopy, 21 split the result by who held the scope. They disagree.

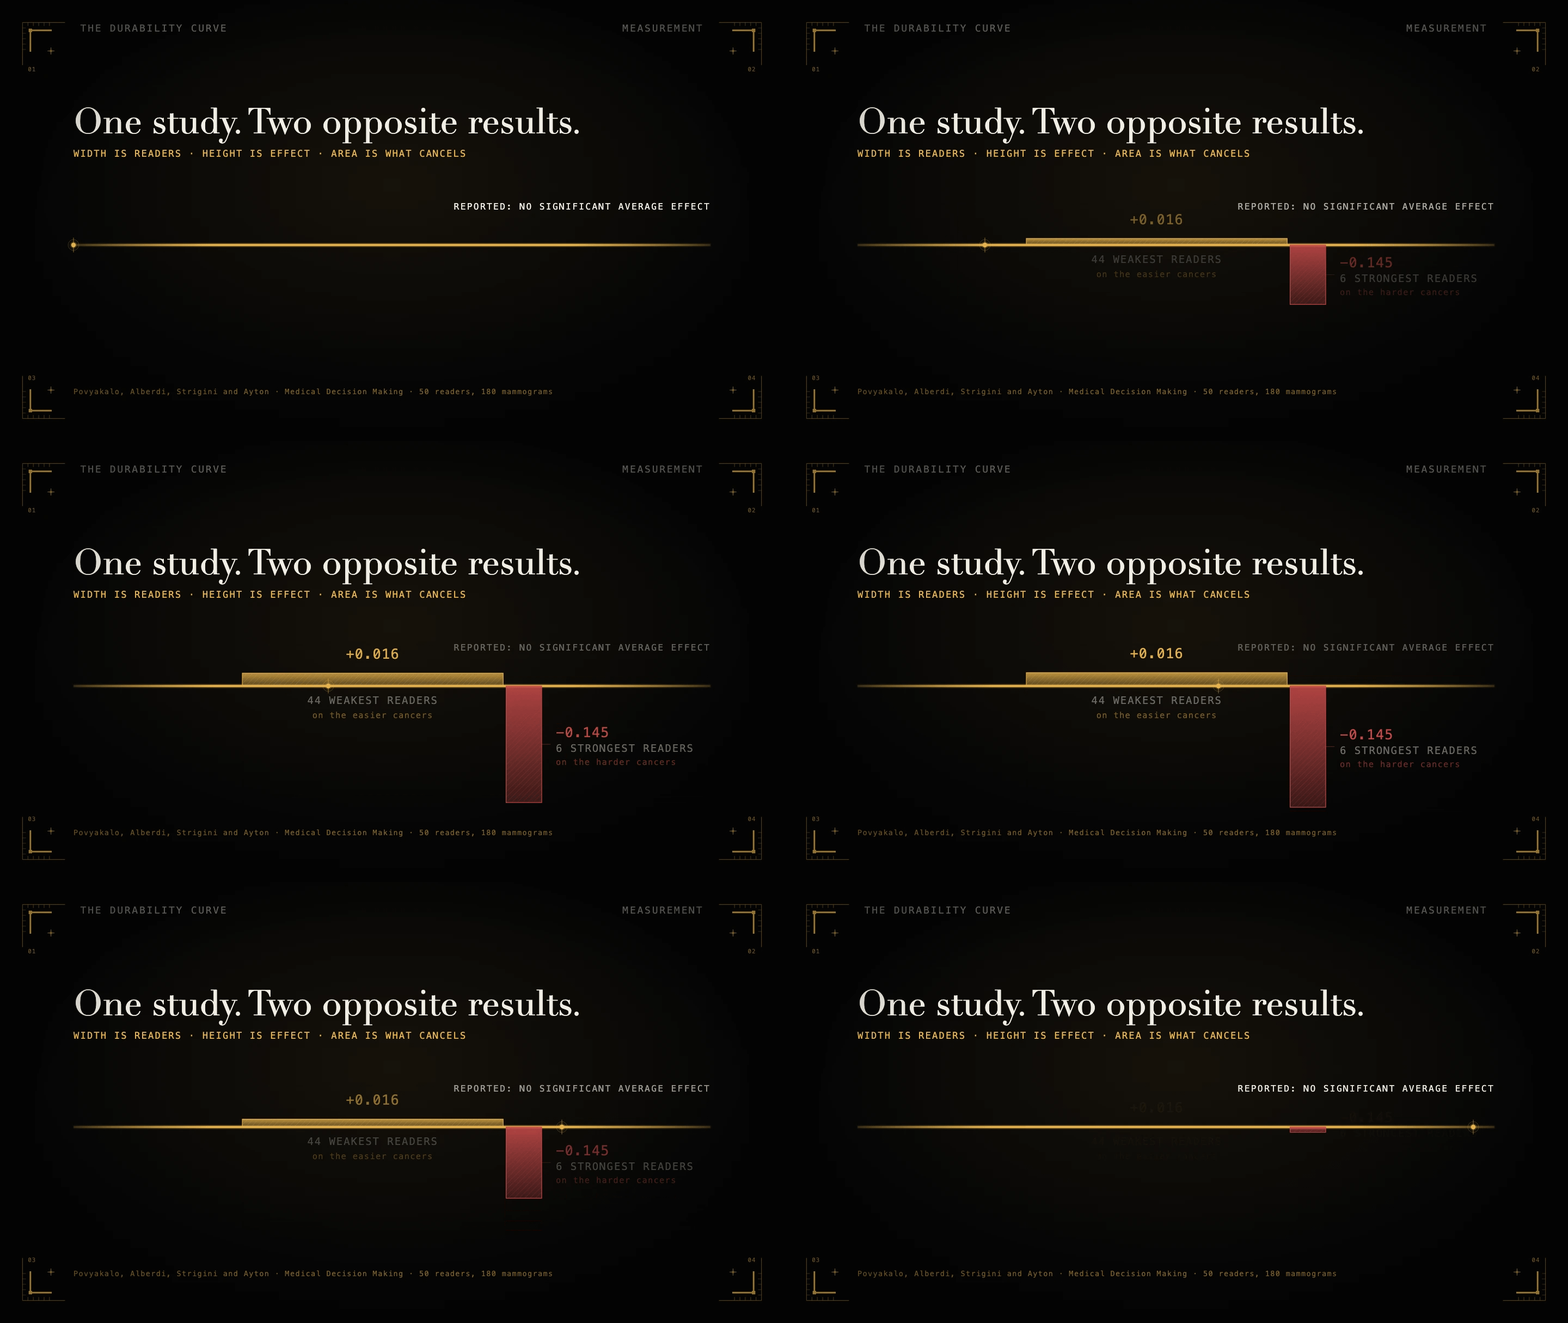
In 2013 four researchers went back to a completed mammography study and asked it a question it had not been designed to answer.
The original study had put 50 radiologists in front of 180 mammograms, twice. Once unaided, once with computer-aided detection marking suspicious regions. The finding was a null. On average, computer aid changed nothing measurable, and the profession moved on.
Andrey Povyakalo and his colleagues at City University London reanalysed the data by splitting the readers instead of pooling them. What they found was that the tool had done two large things at once, in opposite directions. For the 44 least discriminating radiologists, on 45 relatively easy cancers, computer aid was associated with “a 0.016 increase in sensitivity (95% confidence interval [CI], 0.003-0.028)”. For the 6 most discriminating radiologists, on the 15 hardest cancers, “with CAD, sensitivity decreased by 0.145 (95% CI, 0.034-0.257)”. 1
The weakest readers got slightly better at the cases that were already easy. The best readers got substantially worse at the cases that were hard, which is to say the cases where a radiologist is the only thing standing between a patient and a missed cancer. Averaged together, those two effects cancelled, and the study reported that nothing had happened.
Their own summary of it: “despite the original study detecting no significant average effect, CAD helped the less discriminating readers but hindered the more discriminating readers.” 2
The average was true of neither group.
What Your Number Actually Is
Averages behave like this everywhere, including on the dashboard you looked at this morning.
Take the last tool your organisation rolled out and measured. Somebody produced a figure: review throughput up nine per cent, tickets resolved up fourteen, defect-escape rate down a fifth. That figure was computed across everybody who touched the work, which makes it a mixture. There were as many different effects in it as there were people, weighted by how much work each of them happened to do that quarter.
A mixture behaves in ways an effect does not. It can be positive while the effect on a third of your team is negative. It can be zero while two large things are happening. And because the weights are your staffing, the mixture is a property of who was on shift as much as of the software. Hire four juniors and your measured number moves without anything about the tool changing, which is also why the vendor’s benchmark never reproduces in your shop.
Say what that nine per cent still is, though, because the argument is easy to overshoot. It is a real answer to a real question: across the actual mixture of people and work you had last quarter, this is what happened. That is worth knowing, and it may well be enough to justify keeping the tool. What it cannot tell you is how to deploy it. Suppose the nine per cent is three senior engineers on migrations and nine juniors on routine diffs. It is equally consistent with the tool lifting the juniors and doing nothing for the seniors, with the reverse, and with a gain for everybody. Those three worlds ask different things of you: which group to train, which to watch, and whether the number survives your next dozen hires. One number is compatible with all three and cannot tell them apart.
I have made a version of this argument before, structurally, in Where Your Metrics Fold: a scalar reading is a lossy projection, and two situations that demand opposite decisions can share one perfectly accurate number. This piece is the empirical half. Here is a documented case where the projection folded, and here is how often anybody bothers to check.
Bound the 2013 case honestly before it carries any weight. It is a post-hoc reanalysis: the strata were cut using thresholds derived from the same regression that produced the estimates, the authors call their own method “exploratory”, and the headline decline rests on six radiologists. 3 The contrast is also conditional on two things at once, reader ability and case difficulty, rather than being a simple comparison between stronger and weaker readers.
One case establishes one thing, and it is enough: an average can conceal two opposite effects, undetected, in a published null result, in exactly the class of tool everyone is now buying. Whether it usually does, nobody can say.
So how often does anyone look?
21 of 255
I could not find a count, so I made one.
I chose a field unusually favourable to finding operator-level analysis. Adenoma detection rate in colonoscopy, ADR in the literature below, is a hard, standardised, patient-relevant endpoint, and computer-aided detection has been trialled against it more heavily than anywhere else in medicine. If a field splits its results by operator anywhere, it splits them here.
The corpus is a frozen PubMed query: 259 records, 255 with abstracts. The question asked of each one was narrow and fixed before any reading began. Does this abstract report the assistant’s effect separately for two or more groups of operators, defined by something about the operator, such as baseline detection rate, experience, training year, sex, or individual identity? Describing your cohort as experienced does not count. Splitting by patient age does not count.
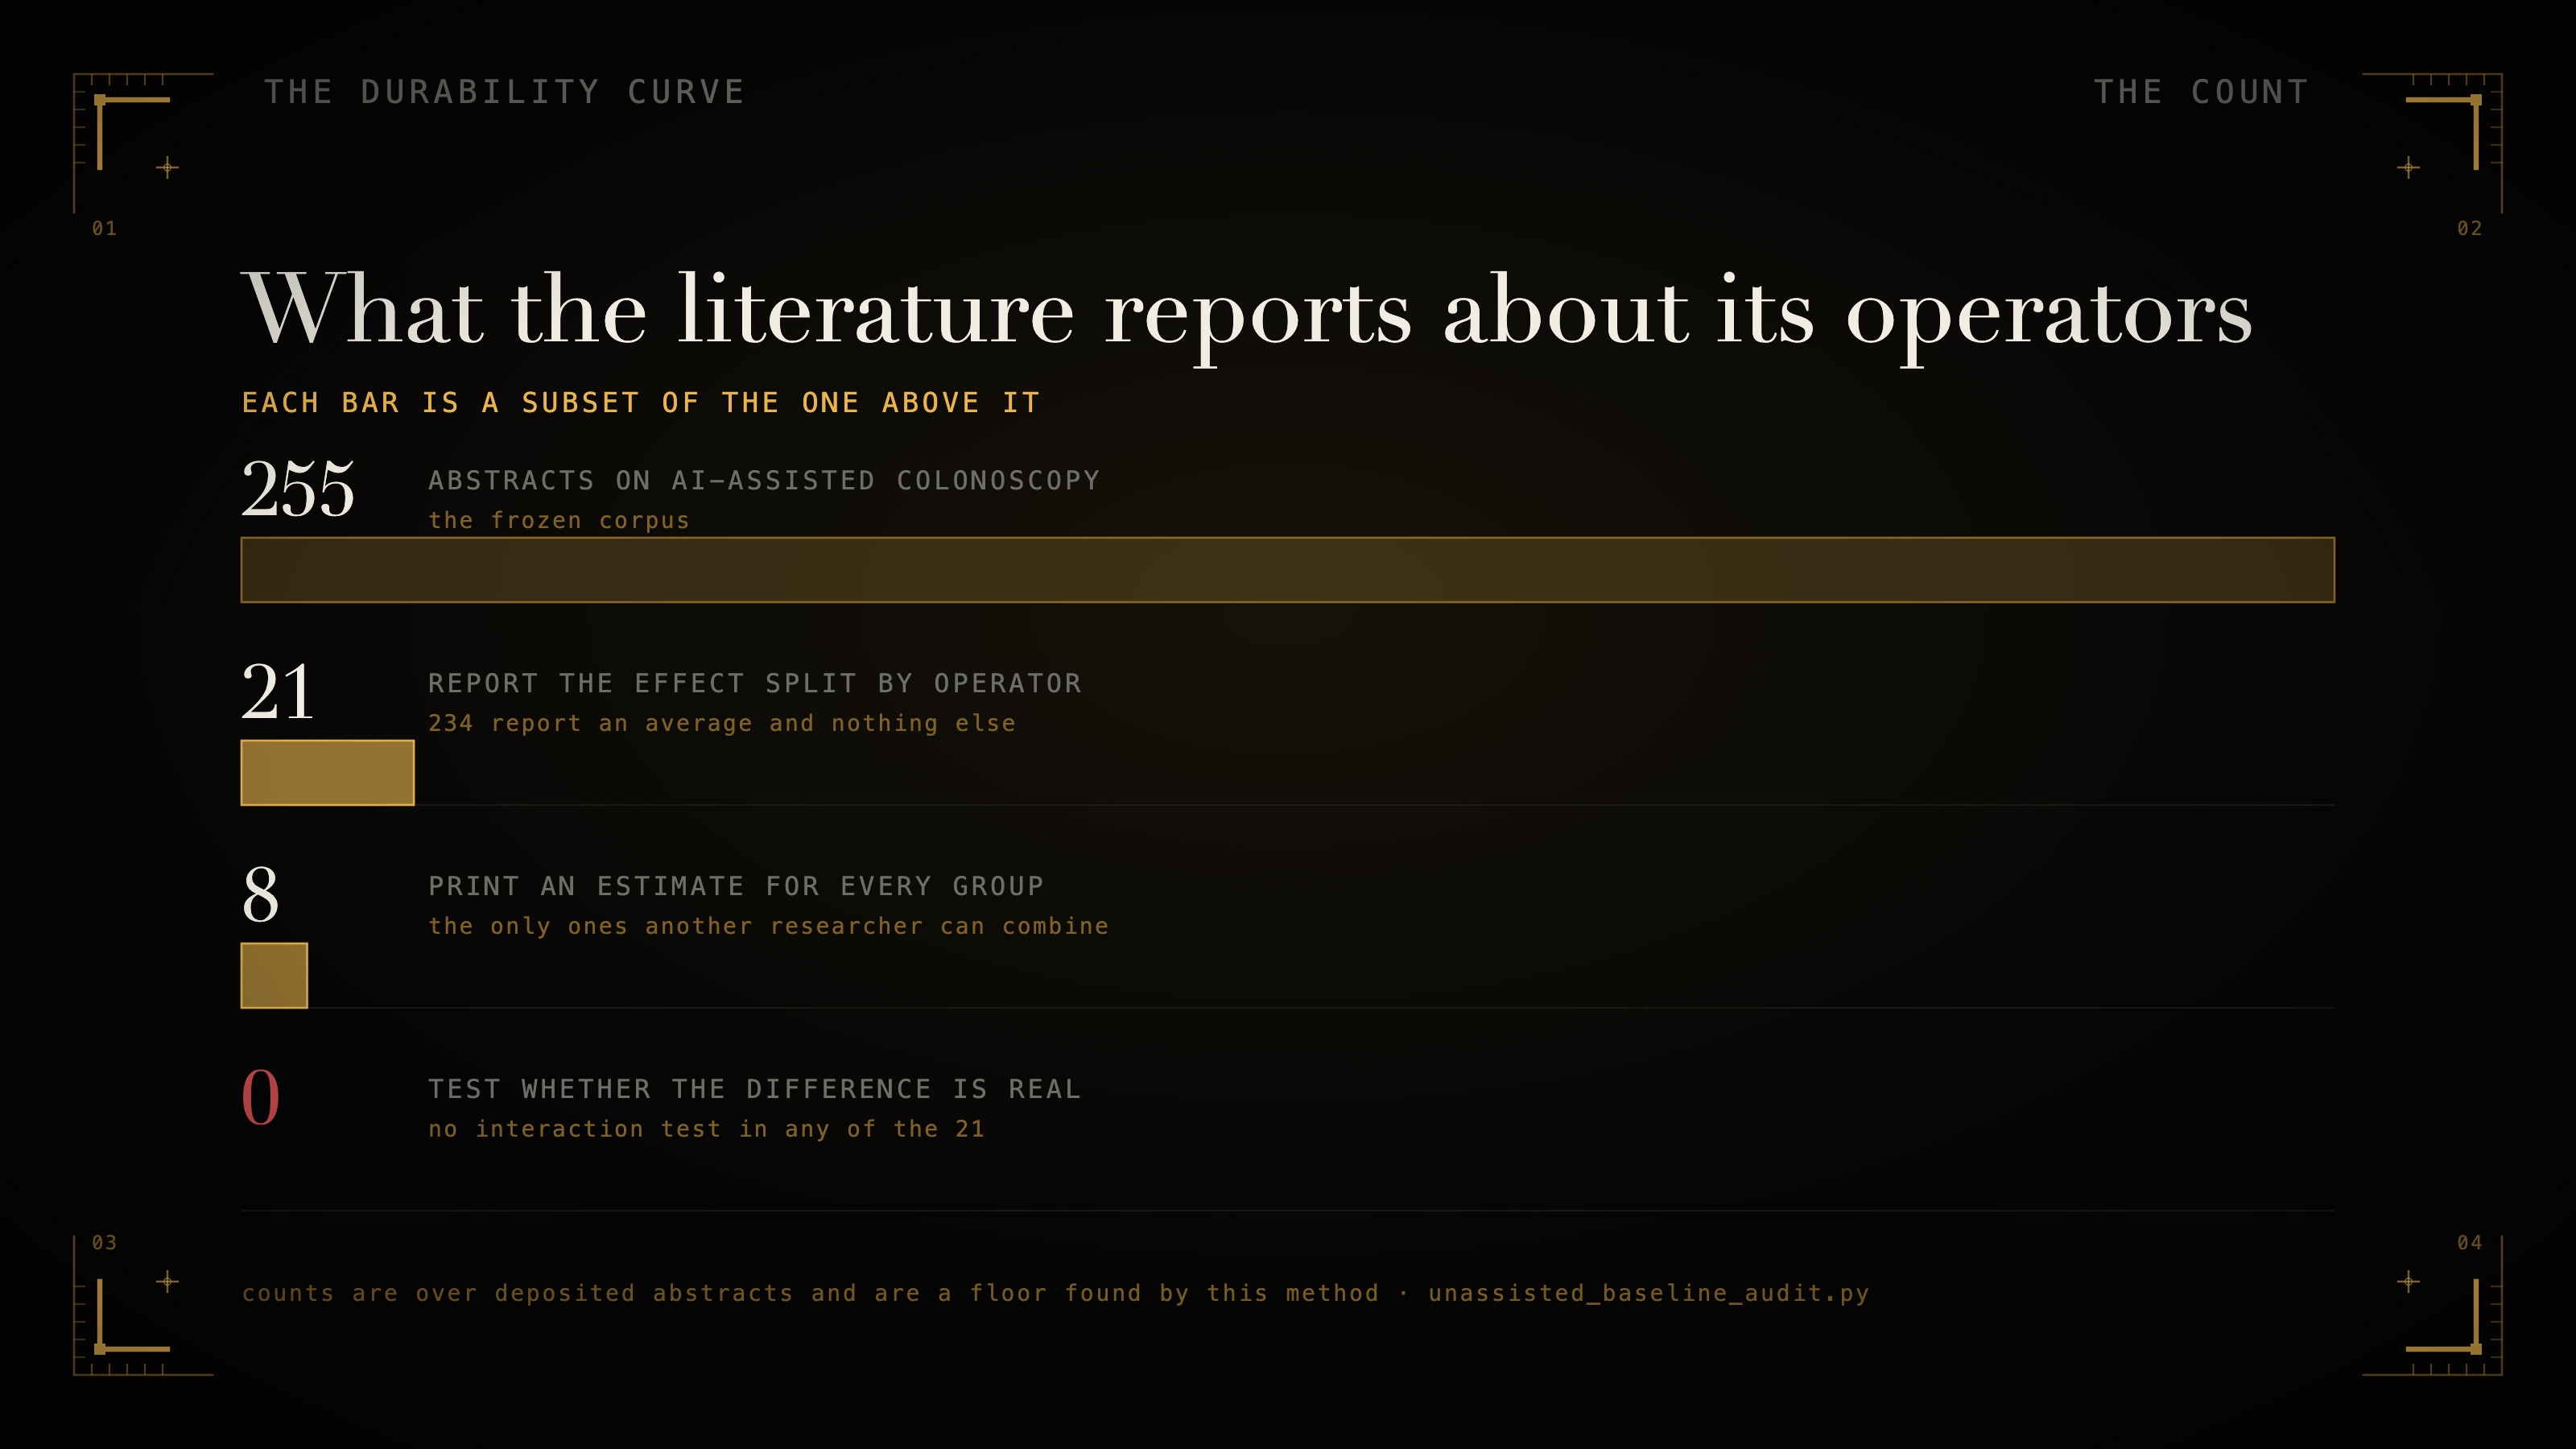
Twenty-one of the 255 report the effect split by the operator. The other 234 abstracts report an average over operators and no operator-level effect. 4 Counting only primary studies, by PubMed’s own publication-type labels rather than my judgement, it is 21 of 157.
That number is scoped in two ways, and the scope travels with it everywhere it appears here. First, these are deposited abstracts. A study can disaggregate in its full text and never say so, so what this measures is the layer the field summarises itself in, which is the layer guidelines, press coverage and most readers stop at. I checked that limit rather than waving at it. In a seeded random sample of twenty of the average-only primary records, nine have open full text and none of the nine reports an operator split in its results. One mentions a colonoscopist subgroup in the future tense, being a protocol promising an analysis to come. 5 The other eleven are paywalled and unread, and open-access status is not random.
Second, and more importantly, 21 is a floor. I will come back to why.
The Ones Who Looked Disagree
Twenty-one studies did the split. If the answer were obvious, they would agree.
In a population-based randomised trial in the Galician screening programme, 4,824 surveillance colonoscopies, with the operator split prespecified rather than fished for afterwards, computer aid “increased ADR among low-performing (ADR<54.5%) endoscopists (45.5% vs 52.1%; aRR 1.15 [95% CI 1.01-1.30]), but not among high-performing endoscopists (65.9% vs 63.5%; aRR 0.96 [95% CI 0.88-1.05])”. 6 The tool lifted the weaker operators and did nothing, numerically slightly less than nothing, for the strong ones.
In a multicentre randomised trial across six centres in Hong Kong and mainland China, 3,059 patients, it went the other way. Detection rose for both groups, and by more in the experts: 42.3% against 32.8% for experts, 37.5% against 32.1% for non-experts. 7
Pooling two randomised trials, one run in experts and one in colonoscopists still in training, a team writing in Gut found computer aid mattered (RR 1.29, 95% CI 1.16 to 1.42) and operator experience did not (RR 1.02, 95% CI 0.89 to 1.16), concluding that “experience appears to play a minor role as determining factor for ADR”. 8
Across the 21, seven report the larger effect in the weaker operators, four in the stronger, three find no interaction, three find nothing that survives stratification, and one finds the two groups diverging over time. 9 Both directions appear in randomised trials, on the same endpoint, in the same procedure.
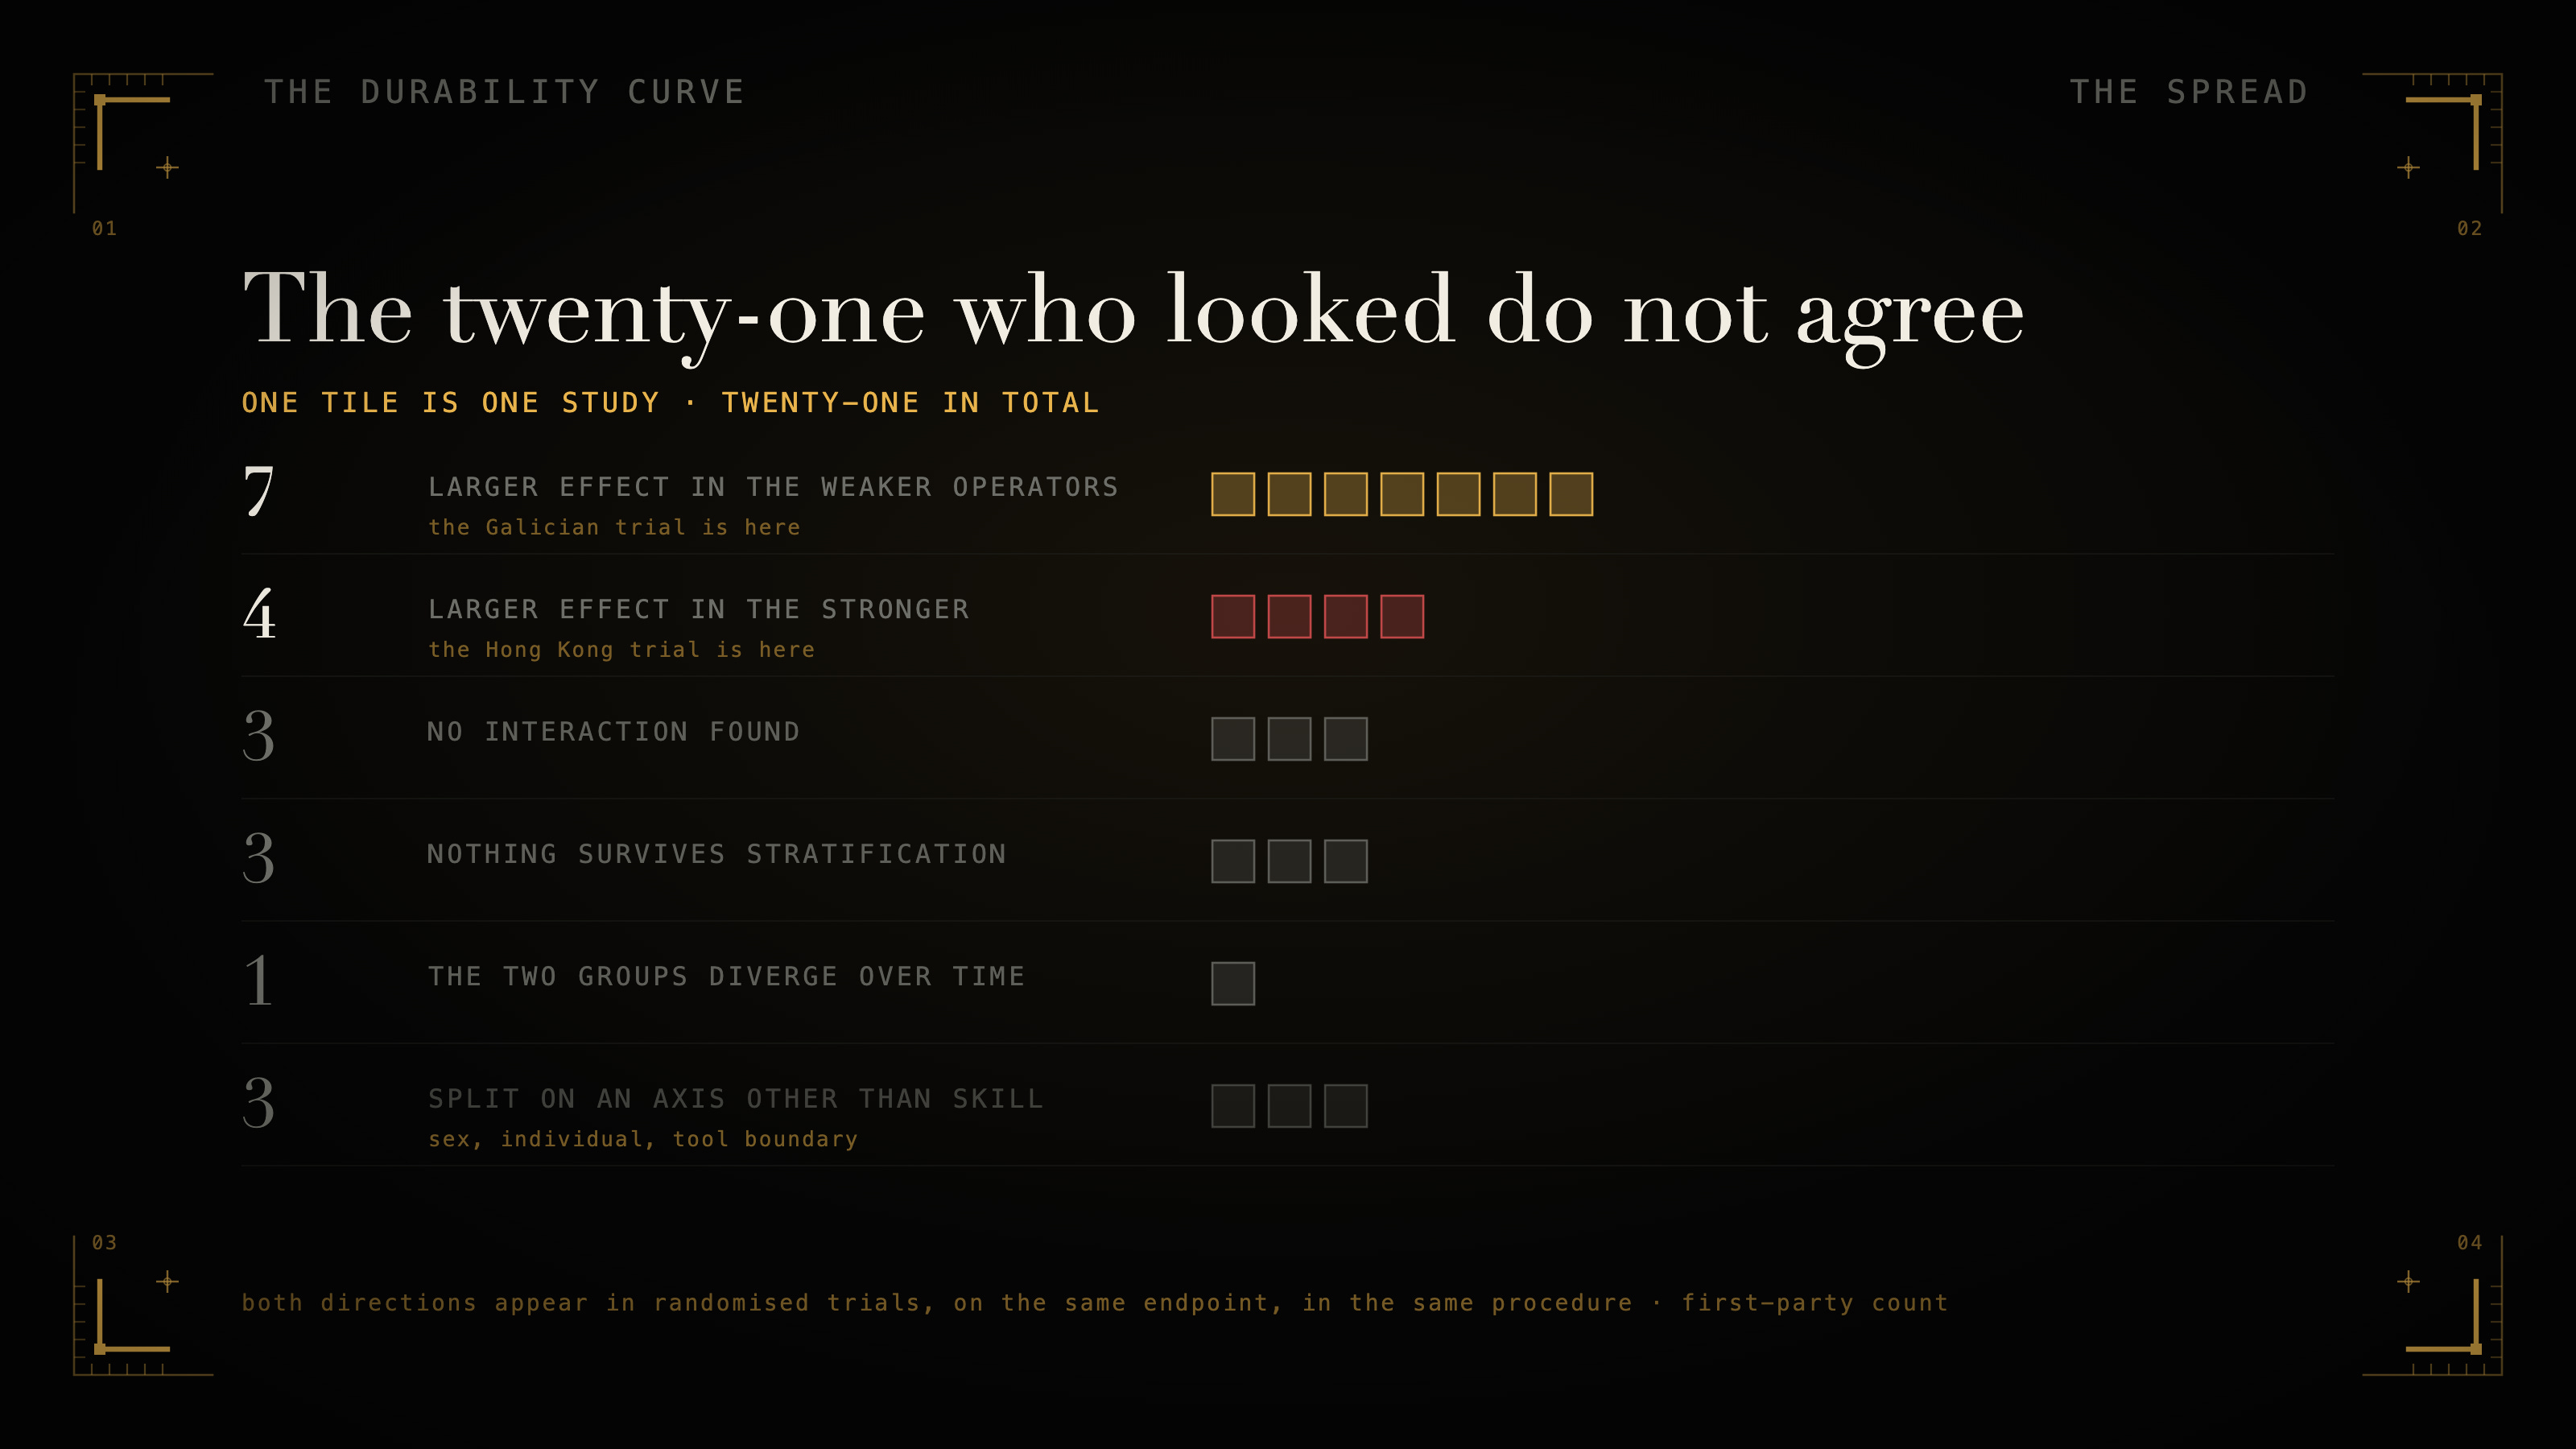
The honest reading of that spread is that the literature has no stable answer about which operators benefit most. A reader who files it away as “the effect is probably small” has reached a different conclusion, and the two license different decisions. This is the three-worlds problem from a few hundred words ago, except now it is not hypothetical: one of the most heavily trialled areas of AI assistance in medicine contains randomised trials pointing in opposite directions about which operators benefit, and it has not resolved them.
Looking Is Not Enough
Here is the part that surprised me, and it is worse than disagreement.
Of the 21 studies that split by operator, only eight print effect estimates for every group, in a form another researcher could combine or check. Three give a number for one group and declare the other null without printing anything. The remaining ten report a direction or a verdict: significant here, not significant there, no estimates at all. 10
And in none of the 21 abstracts is there a test of the interaction. Not one asks, where a reader can see it, whether the difference between the groups is itself distinguishable from noise.
What most of them do instead is compare significance across subgroups. Andrew Gelman and Hal Stern named that error in a paper whose title is the whole argument: “The Difference Between ‘Significant’ and ‘Not Significant’ is not Itself Statistically Significant”. As they put it, “even large changes in significance levels can correspond to small, nonsignificant changes in the underlying quantities”. 11
You can watch it happen. A 2026 study in Diseases of the Colon and Rectum looked at 2,327 colonoscopies and split three ways. Its stated expectation, in its own abstract, was that “the greatest increase was expected among low-volume and junior endoscopists”. What it reported was that “of 12 senior and 12 junior endoscopists, the seniors had a statistically significant increase (p = 0.02) from 51.7% to 59.6%, whereas juniors did not (56.2% to 62.9%, p = 0.12)”. It concluded that computer aid “correlated with an increased adenoma detection rate for experienced endoscopists”. 12
Do the subtraction the paper does not. The seniors improved by 7.9 points. The juniors improved by 6.7 points. The gap between those two improvements is 1.2 points. One crossed a significance threshold and one did not, and the conclusion was written from the thresholds rather than from the estimates.
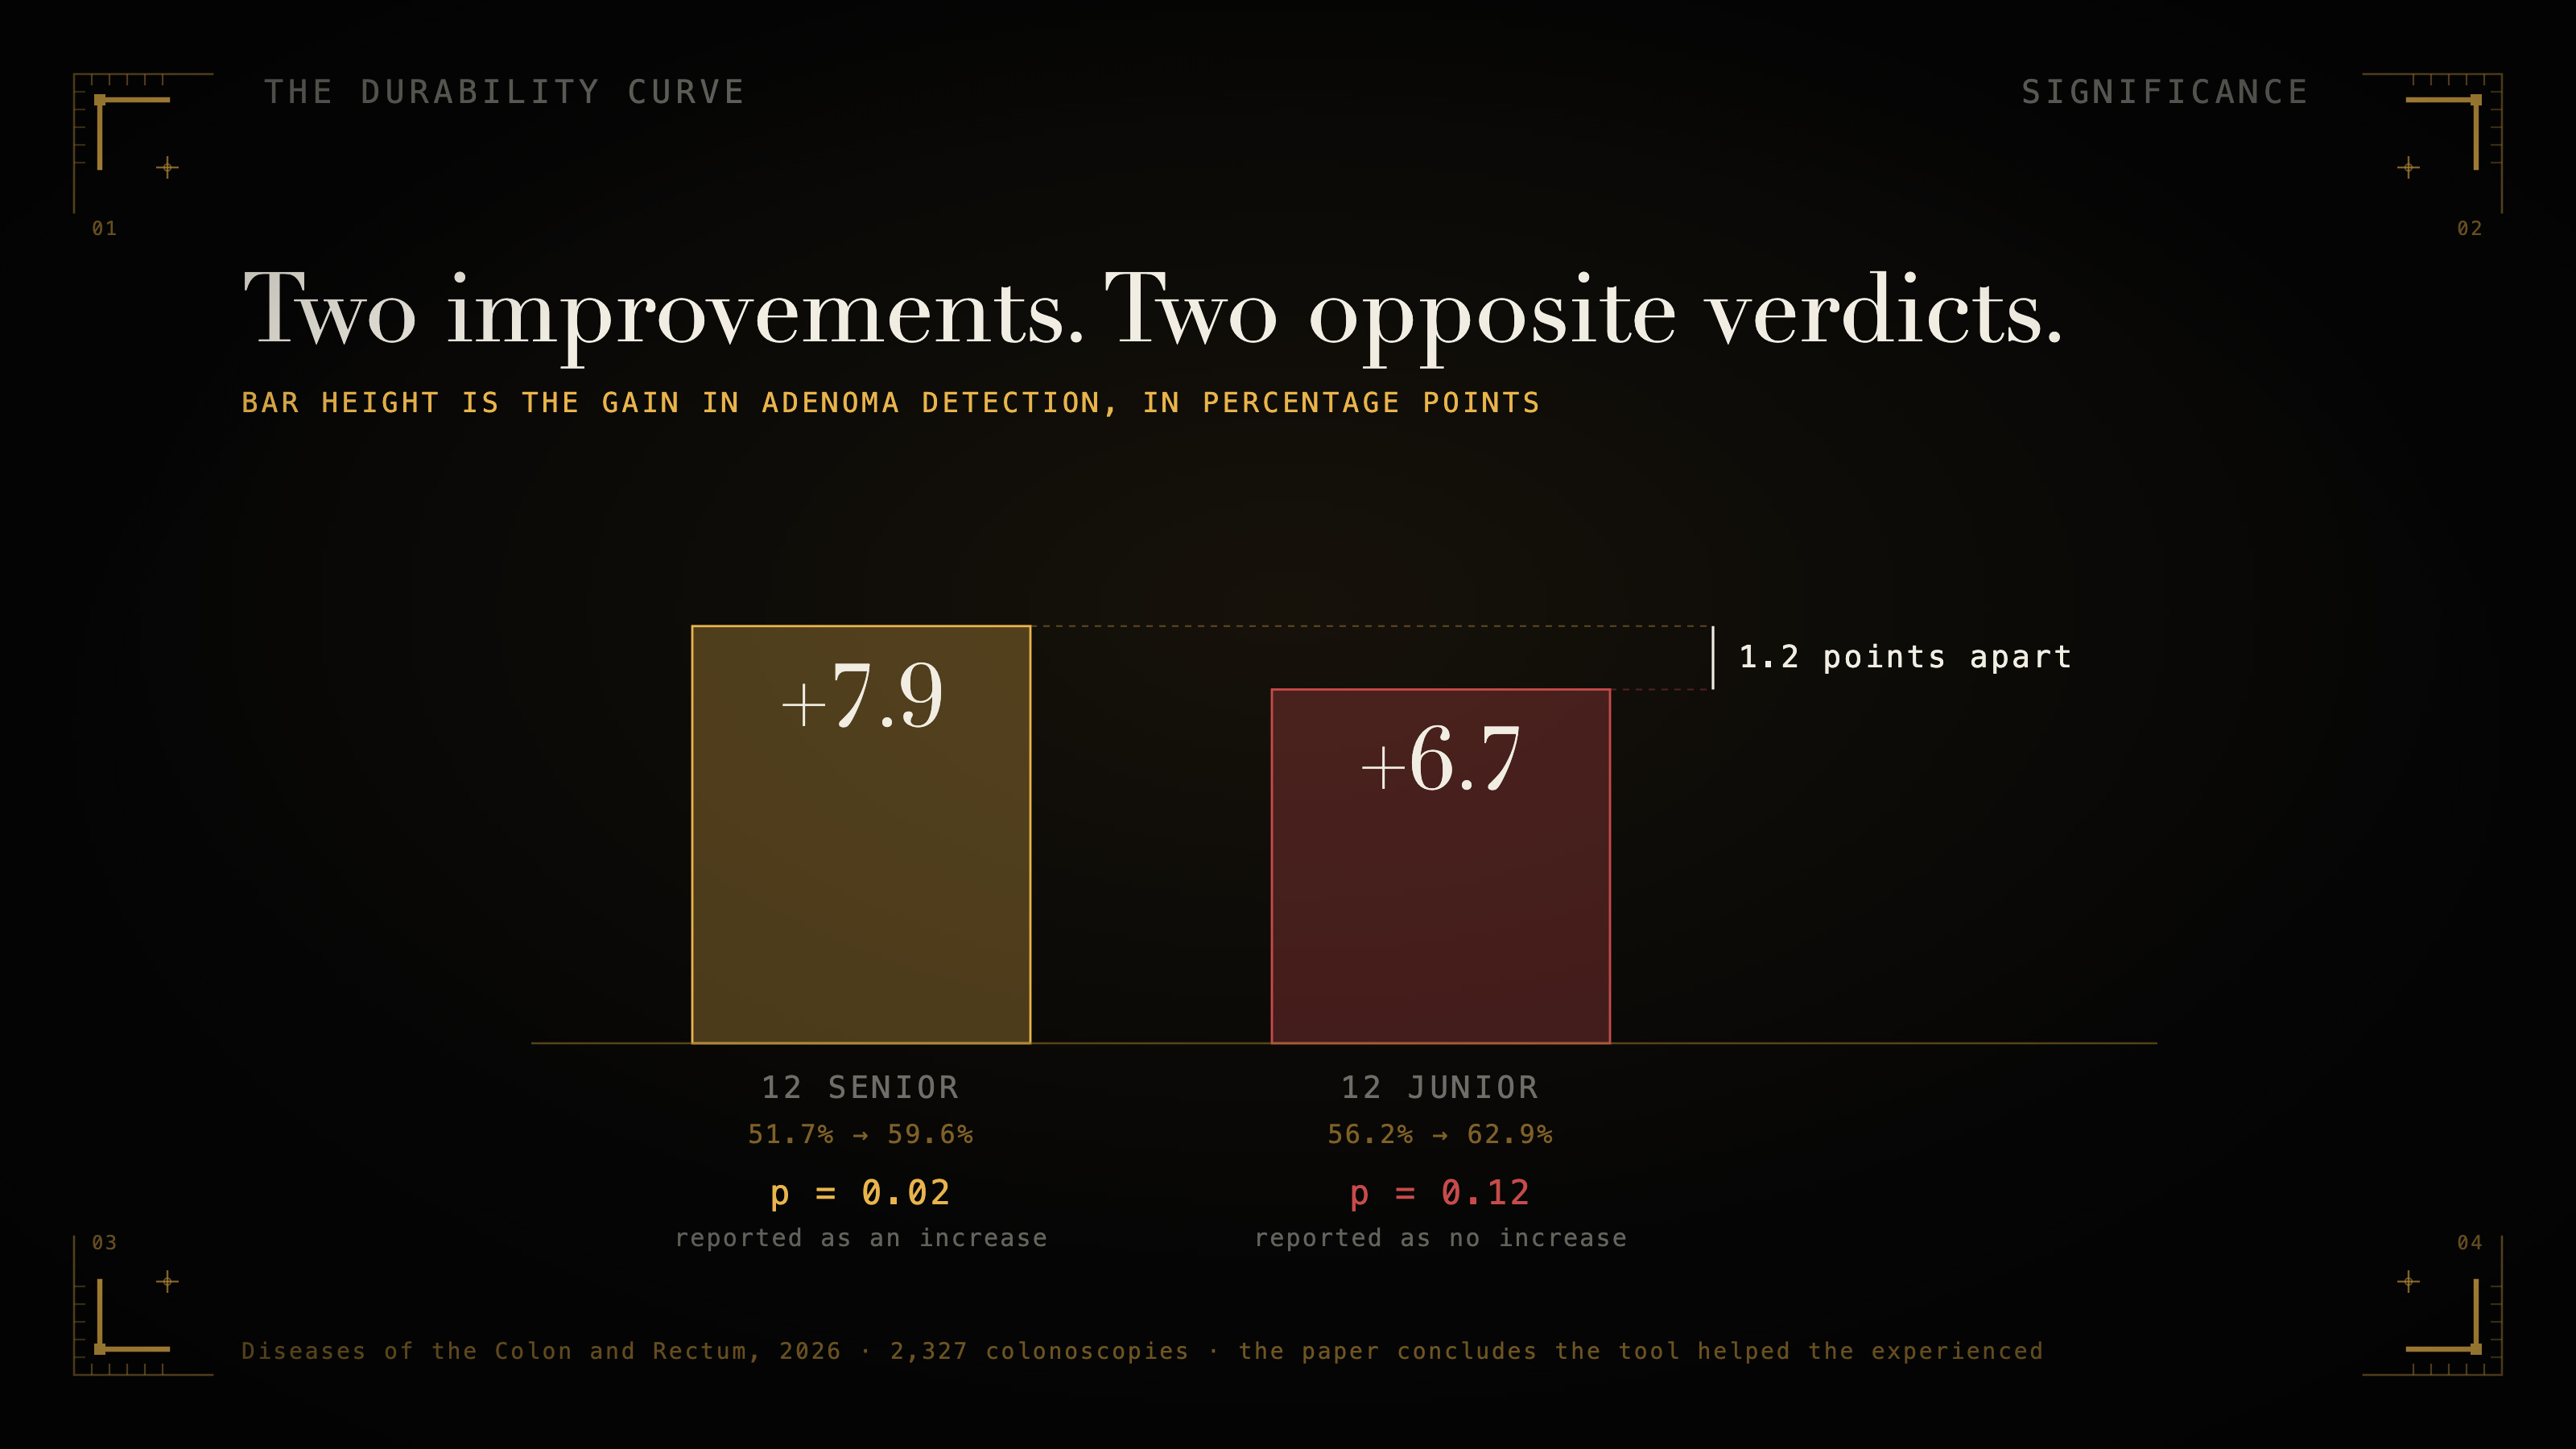
I am not saying that finding is wrong. It may well be right. I am saying the split as published cannot support it, and that the same reasoning shows up repeatedly in the abstracts I read. That is the test to carry out of this piece: when you are shown two subgroups and two p-values, subtract the point estimates before you believe the story.
There is a fair objection here, and a good statistician makes it first. Subgroup analysis has a bad name for good reasons. Cut the data enough ways and something will cross a threshold, and the thing that crossed is what gets written up. That complaint is about testing many subgroups and reporting the winner, and it has standard safeguards: choose the split before you look, report an estimate for every group rather than a verdict, and say how many splits you examined. One prespecified split with intervals is the best defence against subgroup fishing rather than an instance of it. It is not a complete one. Interaction tests are routinely underpowered, cutting a continuous skill measure into groups puts the boundary somewhere arbitrary, and subgroups can differ in the work they were given as well as in who did it. Among the 21, the Galician trial is the one that took the precautions.
Medicine is only where the evidence happens to be. If a coding assistant lifted your median review throughput, and three of your reviewers handle the hairy migrations while nine handle routine diffs, you have two populations and one number, and nothing in that number tells you which of them moved.
Why You Cannot Look This Up
I built three detectors for operator splits, deliberately unlike each other.
The first used the vocabulary anyone would reach for: high detector, low detector, baseline ADR, stratified by experience. It flagged fifteen records. I read all fifteen and seven were real, the rest being the word “quartile” in a patient age range or a study describing its own cohort as experienced. The second looked for an operator noun near a splitting verb and found ten genuine splits the first had missed entirely. The third used pairs of operator labels and no verb at all, and found four more that neither of the others reached. Precision across the three runs 0.47, 0.36 and 0.69, and coverage of the 21 runs 0.33, 0.67 and 0.43. 13 The pattern anyone would write first reaches a third of them.
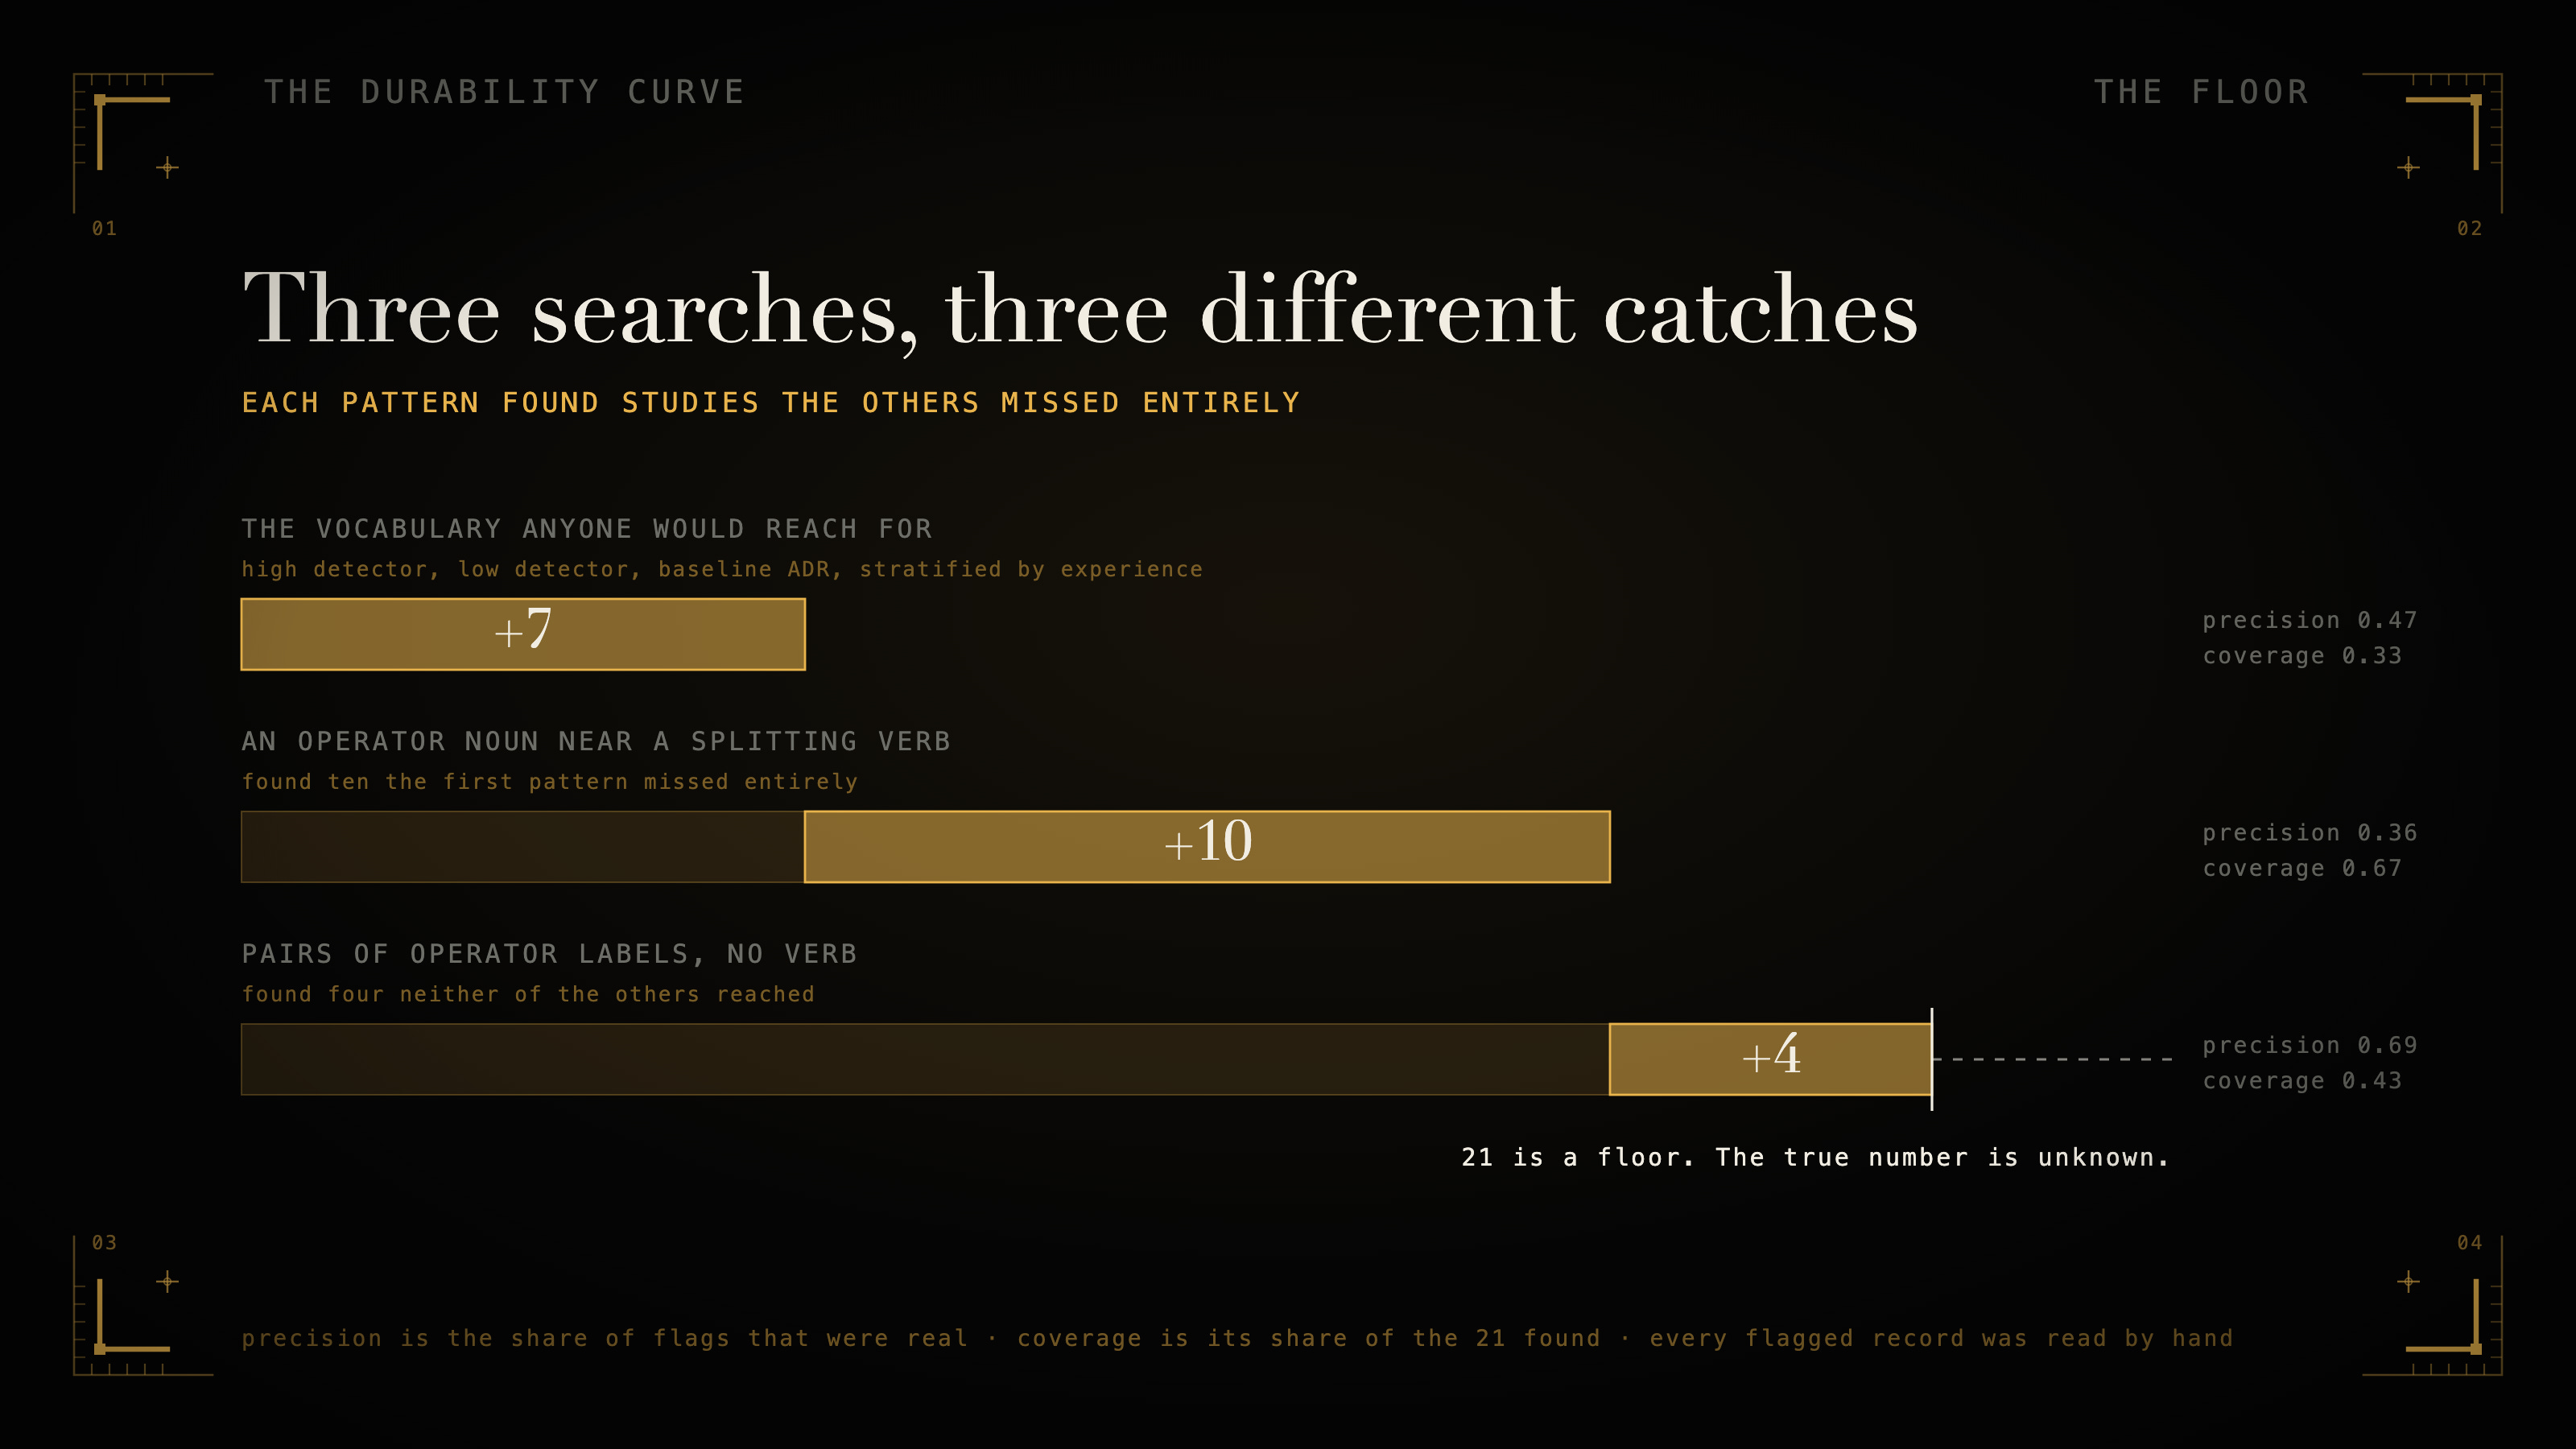
I am calling that coverage rather than recall on purpose. Recall would need the true number of operator-splitting studies in the denominator, and the point of this section is that I do not know it. Twenty-one is a floor: three dissimilar patterns each found what the other two missed, and the additions, seven then ten then four, suggest convergence without demonstrating it. Since the real denominator is larger than 21, every figure above is an upper bound and each pattern is at best that good. Every count here is what this method found, and I cannot tell you what exists.
The reason is structural, and it is checkable. CONSORT-AI is the reporting standard for trials of AI interventions. It asks investigators to “specify whether there was human-AI interaction in the handling of the input data, and what level of expertise was required of users”. Its guidance encourages exploring “differences in performance and error rates across population subgroups”. 14 So the standard has a field for describing your operators, and a field for splitting by patient. It has no field for splitting by operator.
No required field means no standard phrase. No standard phrase means no search term, no index entry, no way to ask the literature this question except by reading it. Which is the same reason work nobody can check tends to look excellent. The absence of a check is a state with consequences of its own.
The Trial That Promised the Split
COLO-DETECT was a good trial. Twelve NHS hospitals, 2,032 participants, published in The Lancet Gastroenterology and Hepatology in 2024. Its protocol, two years earlier, saw this coming. A range of colonoscopist experience was “anticipated and desirable”, and the protocol set out exactly how it would be graded, by accreditation status and lifetime and annual procedure counts, so that it could be analysed. Under the analysis plan: “Subgroup analyses will be conducted on colonoscopist type (i.e., non-BCSP accredited vs. BCSP accredited) and indication for colonoscopy (screening vs. symptomatic).” 15
What reached the abstract two years later was one number. Adenomas found in 56·6% of the assisted arm against 48·4% of the standard arm, adjusted odds ratio 1·47 (95% CI 1·21 to 1·78). 16 No colonoscopist subgroup appears in it. Be precise about what I checked: that paper is not open access and I have not read its full text, so the claim is that the split was pre-registered and the abstract reports the average alone. The analysis may well be sitting in the full paper. It is not in the layer everybody reads.
The Answer the Field Already Gives
The strongest objection is that this has been settled, and it comes with evidence.
A 2025 systematic review pooled twenty-eight randomised trials and 23,861 participants. Its subgroup analyses “involving only expert endoscopists demonstrated a similar effect size (RR, 1.19; 95% CI, 1.11-1.27; P < .001)”, and it concluded that assistance improves detection “irrespective of endoscopist experience”. 17 A second meta-analysis, twenty-four trials and 17,413 colonoscopies, agreed: “type of AI system used or endoscopist experience did not affect overall improvement in ADR.” 18
That is a real answer to a real question, and it is not this question.
Both are comparing trials with each other. They ask whether studies conducted in experts report different effects from studies conducted in mixed cohorts. That is a between-study comparison, and it cannot recover what happens between operators inside a study. A field can run entirely on expert-only trials and mixed trials that produce identical average effects while, inside every one of them, the tool helps some people and hurts others.
That is precisely what happened in 2013. The study-level summary said no significant average effect. The operator-level analysis said the tool helped the weakest readers and hurt the best. Pooling more study-level summaries would have made the first answer more confident and would never have produced the second.
What to Do on Monday
Split the number. How much that buys you depends on where the number came from, and it is worth being exact about this, because the difference is the difference between an effect and a hint.
Start with the design that produced your headline figure, and be honest about what that design can carry. If it was randomised, or otherwise supported a credible causal comparison, run that same analysis again inside each operator group, decided before you look. That gives you an effect estimate per group, on the same footing as the number you already trust, and it is the real move. If it was merely this period against last, the per-group result is a change estimate rather than a clean read on what the tool did, because time, case mix and everyone getting better at their job are still tangled up in it. Either way, report the estimate and its interval for every group rather than which group crossed a threshold, then ask whether the gap between the groups is bigger than the noise. That last question is the one none of the 21 studies answered anywhere an abstract reader could see it.
If there is no comparison in there at all, and what you have is simply how everyone performed with the tool switched on, then grouping by operator gives you something weaker and still worth having. It is a diagnostic, not an effect. Your logs cannot tell the tool apart from who was rostered, which cases arrived, who got better at their job anyway, and who quietly chose not to use the thing. What the split can tell you is whether your operators are spread widely enough that a single number could be hiding two stories, which is precisely the question that decides whether you need a real comparison. Treat a flip in sign as a reason to go and measure properly, not as a finding.
The analysis is cheap either way, an afternoon on data you already hold. The conditions for it to mean anything are not always cheap: enough cases per group to see anything, operator identifiers that are actually clean, and groups doing comparable work rather than comparable-sounding work.
Three outcomes, all of them useful. If the estimates point the same way across groups you have actually measured well enough to read, you have some evidence that your average means roughly what you thought it meant, which is worth knowing and is currently not known. If credible estimates point in opposite directions, your rollout decision was being made on a number that described nobody in particular. Hold the same standard here that you held a paragraph ago: a bare flip in sign can be noise, and estimates agreeing in direction can still disagree wildly in size. And if the groups turn out too small to say, that is still worth having, as long as you read it correctly. Thin cells do not make your overall number wrong. An average across two thousand cases can be perfectly well estimated while twenty groups of a hundred are far too noisy to tell apart. What you have learned is narrower and still useful: your data can support a statement about the deployment as a whole, and cannot yet support any statement about who benefits, who does not, or whether the effect moves across your operators at all. That is the boundary of your evidence, and knowing where it sits is the point of the exercise.
Eight abstracts out of 255 printed estimates for every group. Only those eight expose enough for another researcher to check or combine the subgroup result without writing to the authors.
What none of this can tell you: whether a given tool helps or harms a given group, whether the colonoscopy pattern transfers to your field, or whether that literature will resolve its own disagreement. Twenty-one teams looked and did not settle it. The claim here is narrower and harder to dodge. Operator-level results are almost never visible in this literature’s abstracts, and the nine full texts I could open did not carry them either. The reporting standard has a field for describing your operators and none for splitting by them. And while answering the question properly can be expensive, finding out whether your own data could answer it is not. That much is a choice.
An average is an honest description of a mixture. It just cannot tell you the thing that decides your next move, which is whether the tool is doing the same thing to everyone.
The number you have been reporting is a summary of who happened to be on shift. Whether it describes any of them is a question you have not asked.
If you go and run the split, I would like to know what came back. Estimates pointing the same way across your groups, estimates pointing in opposite directions, or cells too thin to read: all three are results, and at the moment none of them is written down anywhere. The colonoscopy literature has 21 attempts at this question and no answer. Yours would be the twenty-second, and it would be about a system you actually control.
Which number are you judged by that you have never once split by the person who produced it?
New to The Durability Curve? It is a standing argument about what survives when the tools get powerful and the surface gets cheap. Subscribe for the rest, or start with what survives.
