
Three Hidden Bottlenecks the AI Buildout Has Already Moved Past GPUs
NVIDIA's GPU shipments are not the binding constraint anymore. The supply chain has voted on what comes next.

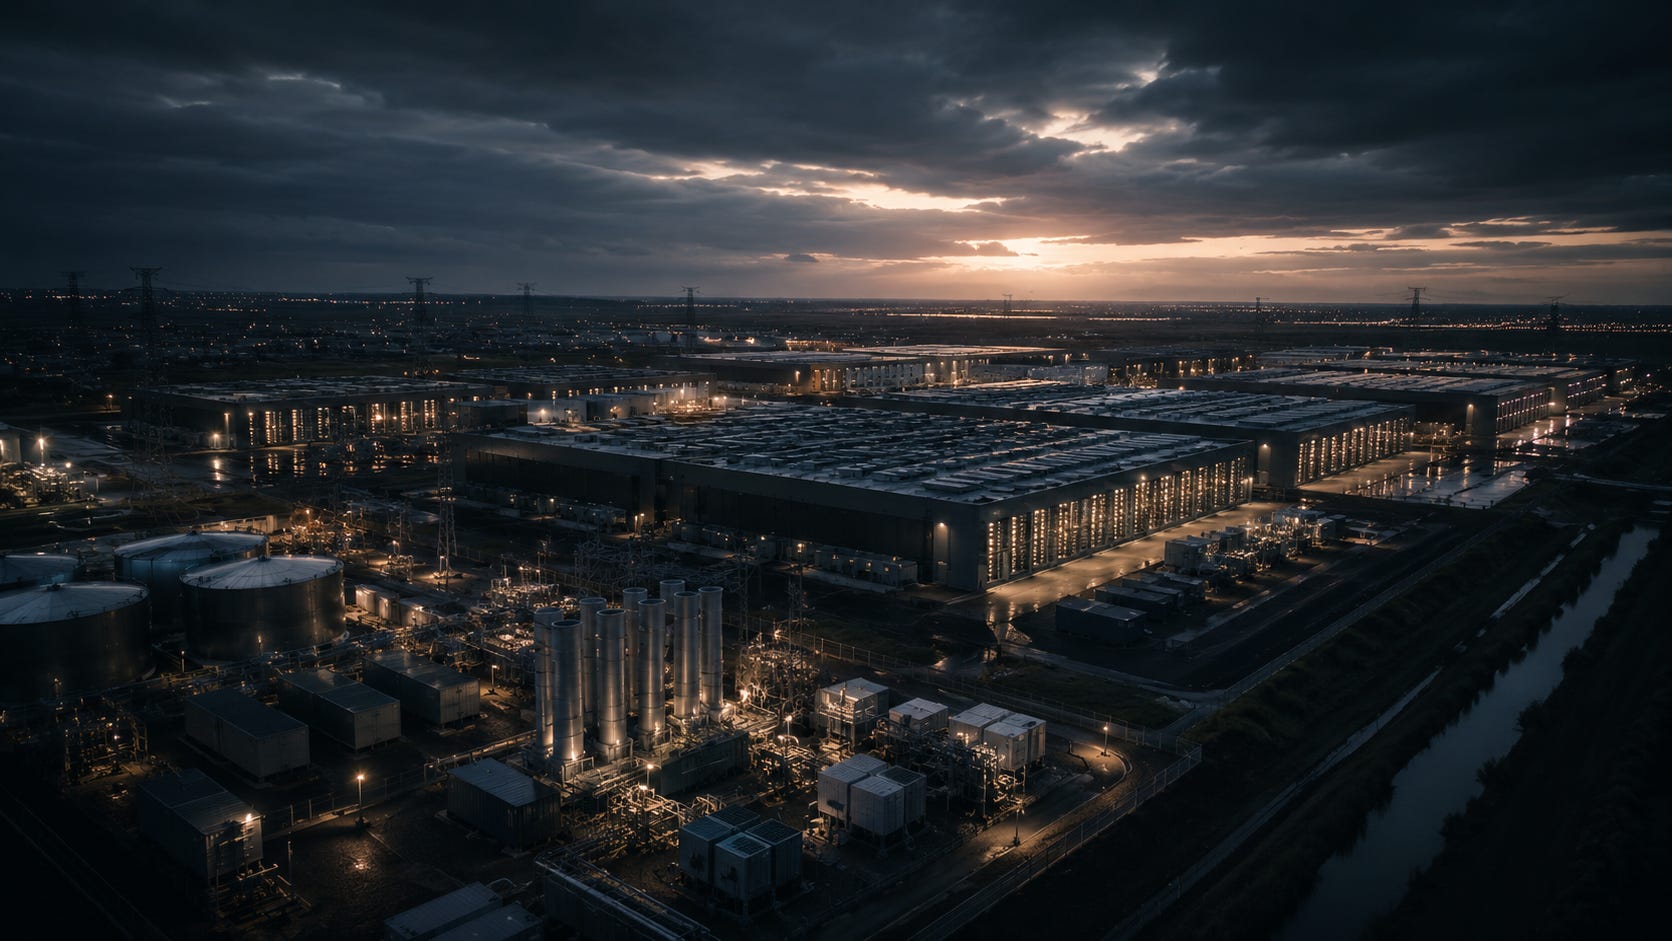
Bloom Energy reported Q1 2026 revenue of $751 million. That number was 130 percent higher than the prior year, 42 percent above consensus, and triggered a full-year guidance raise to $3.6 billion 1. Most of the post-earnings coverage read the print as a fuel cell company finally turning operationally profitable.
The print is not a fuel cell story. It is the canonical evidence that the AI infrastructure bottleneck has migrated past compute.
For two years the consensus model for AI capex has anchored on GPU shipments. NVIDIA, AMD, the hyperscaler capex disclosures, the analyst models all priced compute as the load-bearing constraint. The reasoning was straightforward: training runs scaled, GPU clusters grew from 5,000 units to 50,000 to 100,000, and the company that supplied the silicon owned the bottleneck.
The reasoning was correct in 2023. It became incomplete in 2024. By 2026 it has become a rear-view mirror.
The analyst models that price AI on GPU shipments are not wrong about GPUs being important. They are wrong about GPUs being scarce. The supply-side data has been telling a different story for three quarters now, and Bloom Energy’s print is the most recent confirmation. The bottleneck moved. It always does. The binding constraint never disappears. It only migrates to the next layer.
The question that matters now is which layer the binding constraint has migrated to. Three layers have evidence pointing at them, none of which are GPUs, and the layers compose into a single observation about where AI capex goes once the compute layer has been solved.
The first layer: power, and the 128-week wait
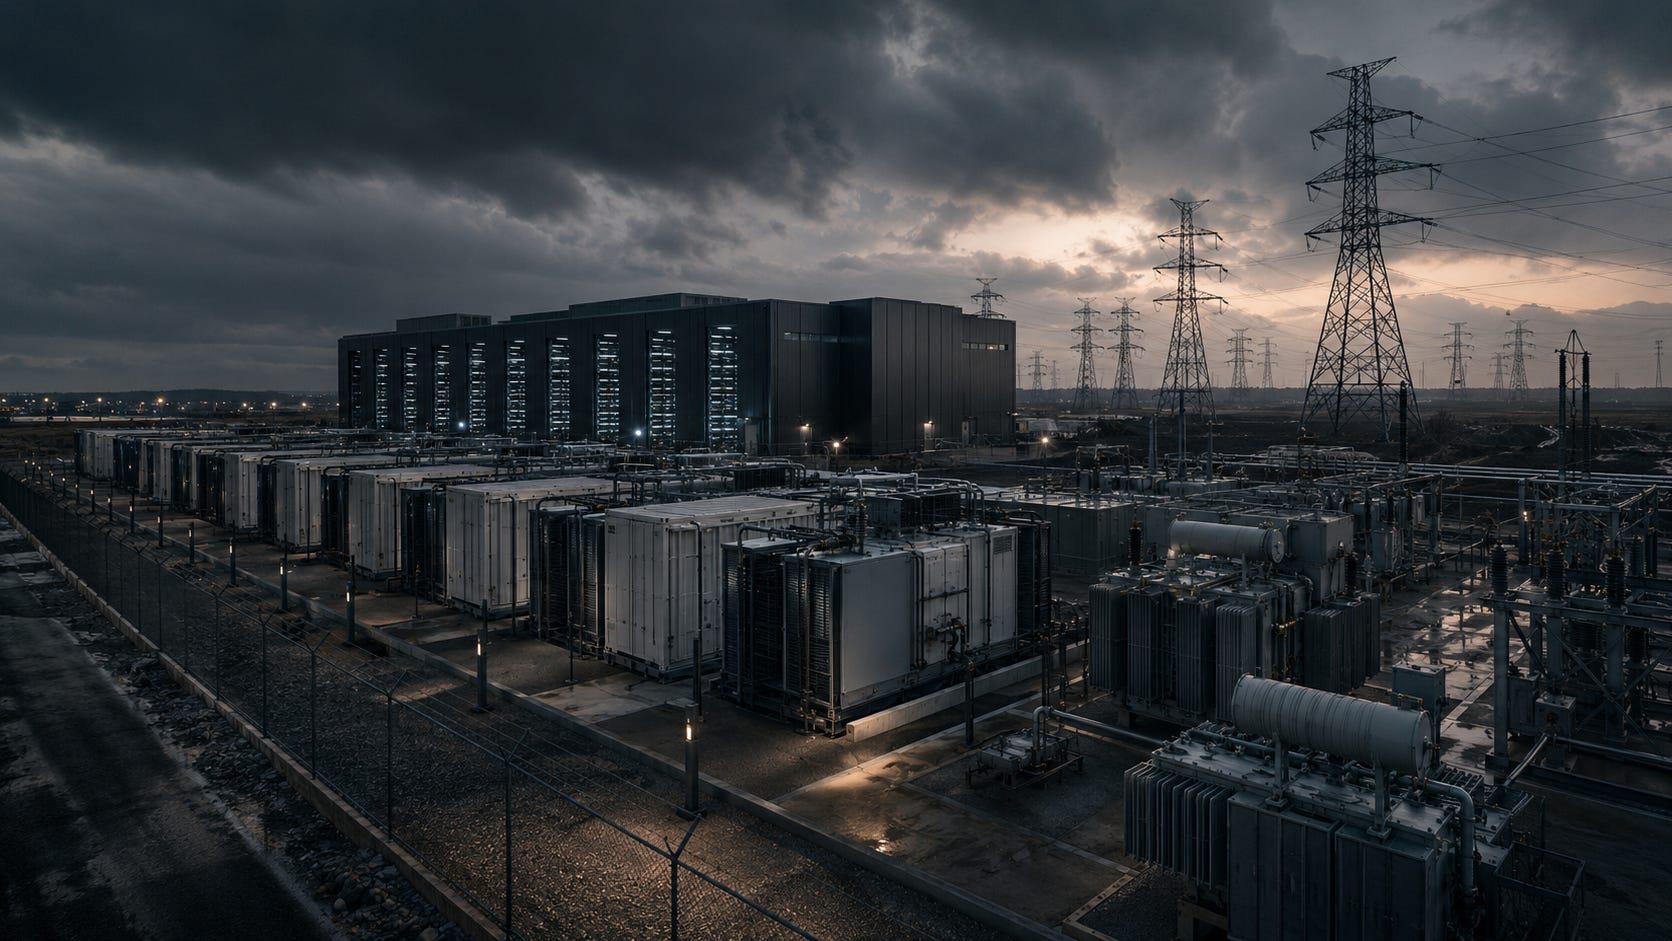
Behind every large GPU cluster sits a power-delivery infrastructure that takes longer to build than the cluster itself. Power transformers, the equipment that steps utility-scale voltage down to data-centre-usable voltage, have 80 to 128 week lead times right now 2. Cleveland-Cliffs is the only domestic US producer of the grain-oriented electrical steel that every transformer core requires 3. The grid interconnection queue at major US utilities runs five-plus years for new high-voltage data centre loads 4.
This is the layer where Bloom Energy fits, and where the print becomes legible. Solid oxide fuel cells generate power on-site, behind the meter, without queueing for grid interconnection. A hyperscaler that wants 100 megawatts of power in eighteen months and cannot get it from the grid for five years buys Bloom Energy units. The fuel cell technology is twenty years old. The 130 percent revenue growth is the price of how binding the power constraint has become.
A hyperscaler that wants 100 megawatts in eighteen months and cannot get it from the grid for five years buys Bloom Energy units. The 130 percent revenue growth is the price of how binding the power constraint has become.
For beginners: what does “behind the meter” mean? A utility meter measures power coming into a building from the grid. Behind the meter means power generated on the customer’s side of that meter, so the grid never sees it and never has to plan for it. Bloom Energy’s fuel cells are behind-the-meter generation. That is why the eighteen-month installation timeline is the only one that matters for a hyperscaler who cannot wait five years for grid interconnection.
The falsifier for the power layer is specific. If transformer lead times compress below 52 weeks within two consecutive quarters, or if hyperscaler 24/7 firm clean power purchase agreements (PPAs) at 15-year tenors are consistently signed below $80 per megawatt-hour, the constraint has eased and the behind-the-meter premium decays. Watch the second of those harder than the first. Hyperscalers will pay whatever the grid cannot deliver fast enough, and the PPA price is where that desperation gets numerical.
The second layer: metal, and the recycling angle nobody priced

The compute layer requires copper. The power layer requires copper. The interconnect layer requires copper. By 2030, AI data centres alone will be calling on roughly 7 percent of all the copper the world digs up in a year, from a demand source that did not meaningfully exist five years ago. The math is straightforward. Hyperscale AI sites consume 40 to 50 tons of copper for every megawatt of IT capacity 5. The US has 85 gigawatts of new pipeline through 2030 6, with 35 gigawatts already under construction across North America 7. Wood Mackenzie projects 1.1 million tonnes per year of grid copper demand from data centres alone 8; BloombergNEF projects another 572,000 tonnes peaking in 2028 inside the facilities themselves 9. Combined, that approaches 1.7 million tonnes per year against global mine output of roughly 23 million tonnes annually 10. One new demand source, 7 percent of every mine on earth, on top of every other demand the market already cannot meet.
Mine capacity does not flex on the timescales the buildout requires. Copper mines take a decade from greenfield discovery to first commercial shipment. The buildout is happening on a one-to-three year horizon. There is no path where new mining capacity meets new data-centre demand.
The consensus copper-AI thesis names the major miners: Freeport-McMoRan, Southern Copper, BHP, Rio Tinto. The miners are the obvious read. The recycling angle is the underfollowed one. Aurubis is a German specialty metals conglomerate that runs the largest secondary copper smelting capacity in Europe and is building the first US secondary smelter. Recycling output can flex on the timescales primary mining cannot. The structural shift is from mining is the bottleneck to recycling is the relief valve. The equity that captures the relief valve trades at approximately 0.4 times price-to-sales 11. The market reads Aurubis as a commodity cyclical. The multiple ignores the data-centre demand curve.
The structural shift is from “mining is the bottleneck” to “recycling is the relief valve”. The equity that captures the relief valve trades at roughly 0.4 times price-to-sales. The multiple ignores the data-centre demand curve.
This publication tracks where capital is migrating before the analyst models reprice it.
The falsifier for the metal layer is observable and time-bound. If primary copper-mine output growth exceeds 10 percent year-over-year for two consecutive years, the supply-shortage premium for recyclers compresses. The fallback test: if hyperscaler-driven data-centre permitting decelerates by more than 30 percent year-over-year, the demand assumption breaks before the supply assumption fires. Watch the permitting numbers monthly. The construction pipeline is the leading indicator of the copper demand curve.
The third layer: detection, and the $151 billion question

The third layer is the most speculative of the three, and also the one where the supply side is voting hardest. The reason markets have not priced it yet is that the contract that creates it was only finalised in January 2026. SHIELD is the Scalable Homeland Innovative Enterprise Layered Defense vehicle: a $151 billion ten-year contract the Missile Defense Agency awarded as the primary acquisition framework for the broader Golden Dome missile-defence initiative 12. Golden Dome itself sits above SHIELD as the umbrella programme, with the Pentagon’s own ten-year cost estimate at approximately $185 billion and the Congressional Budget Office’s May 2026 analysis projecting up to $1.2 trillion over twenty years if a full space-based interceptor layer is built out 13. The MDA selected 2,440 firms as qualified SHIELD vendors across three tranches in late 2025 and early 2026. Holding a SHIELD position confers eligibility to compete for individual task orders, not guaranteed funding; task-order competitions are now beginning.
The data layer of Golden Dome (the satellites and ground-segment processing that detect, classify, and track aerial threats) is a procurement category that did not meaningfully exist five years ago. Spire Global is a publicly-traded satellite-data company at roughly $700 million market cap 14 with a remaining-performance-obligations backlog above $200 million, equivalent to about three times trailing twelve-month revenue 15. Their core revenue stream is Global Navigation Satellite System (GNSS) radio-occultation weather data, maritime Automatic Identification System (AIS) tracking, and radio frequency (RF) signal monitoring. Each of those data feeds is dual-use. The same instruments serve weather forecasting, shipping logistics, and defence persistent surveillance.
If Spire captures even one percent of SHIELD contract dollars over the ten-year program, that is $1.5 billion in cumulative revenue against the current $200 million backlog. Multiples of trailing revenue visibility. The re-rating mechanism is one event. A SHIELD task-order announcement reclassifies Spire from data subscription business to defence contractor inside a single news cycle. The growth curve does not need to deliver first.
The re-rating mechanism is one event. A SHIELD subcontract announcement reclassifies Spire from data subscription business to defence contractor inside a single news cycle. The growth curve does not need to deliver first.
The falsifier here is sharp. If SHIELD task orders are awarded across the next twelve months and none flow to Spire (if Lockheed Martin, Raytheon, Northrop Grumman absorb the data layer through their own subsidiary acquisitions), the thesis collapses to a $300 to $400 million data subscription company. The current $700 million cap depends on the SHIELD optionality being non-trivial. The probability is unknowable. The binary is well-defined.
The composition the consensus misses
These three layers are not independent positions. They are the three components of a single observation about where the AI capex chain has bound.
Compute is solved at the marginal layer. NVIDIA, AMD, and the hyperscaler custom silicon teams have shipped enough capacity that the binding constraint sits elsewhere. The constraint is upstream and downstream of the chip: upstream because the power and metal that the cluster requires cannot be delivered on the cluster’s timeline, and downstream because the strategic infrastructure that monitors and protects the data centres requires its own procurement category.
The three layers compose because they share the same load curve. The same hyperscaler buildout that drives Bloom Energy’s revenue growth drives the copper demand that Aurubis’s recycling capacity will absorb. The same defence-procurement urgency that makes SHIELD a $151 billion program emerges from the same strategic environment that makes hyperscaler power-delivery a national-security concern. The three layers are not three separate trades. They are one observation, expressed three ways.
Two structural moves come out of this analysis. The first: track where the supply chain is voting before the analyst models price it. The optical commitments NVIDIA made to Corning, Lumentum, Coherent, and Ayar Labs in late 2025 were the upstream signal that the photonics convergence was migrating into the compute interconnect layer. Bloom Energy’s Q1 2026 print is the equivalent upstream signal for power. The supply-side numbers are the leading indicator.
The second move: when the constraint binds, follow the difficulty. The hard part is what produces the value. Building a 128-week transformer is hard. Refining secondary copper to data-centre purity is hard. Carrying persistent space-based surveillance with the calibration and uptime SHIELD requires is hard. Each of these difficulties is what creates the moat for the equity that owns the relevant infrastructure.
What to do with the framework
Three watch items, each with a falsifier so the reader can run the framework themselves rather than wait for the publication to update them.
For power: watch hyperscaler 24/7 firm clean PPAs at 15-year tenors. If those PPAs settle below $80 per megawatt-hour for two consecutive quarters, behind-the-meter generation premium is decaying and the bottleneck is moving back to grid-scale supply.
For metal: watch primary copper-mine output growth. If it exceeds 10 percent year-over-year for two consecutive years, the supply-shortage premium for recyclers compresses and the Aurubis thesis weakens.
For detection: watch SHIELD program subcontract announcements through Q4 2026. If the data layer awards go to primes without Spire in the supply chain, the thesis is falsified and Spire re-rates as a data subscription company.
The whole-framework falsifier is broader. If GPU shipment growth re-accelerates above 100 percent year-over-year for two consecutive quarters AND power, metal, and detection multiples expand simultaneously, the compute layer is back as the binding constraint and the rest of this analysis is a temporary regime that has reverted. The publication will hold this open as a watched possibility, not as an active expectation.
The expectation is that the binding constraint stays where the evidence currently places it. Power, metal, detection. Three layers, three companies, one observation about where the bottleneck has moved. The supply chain has already voted. The analyst models will catch up in two or three quarters. The reader who repositions before they do gets the asymmetric return.
If this framework helps, it composes with two earlier pieces.


makes the same move at a single layer: separating the operating reality of an extraordinary company from the seat public investors actually receive.

makes it again, at a different layer. Both are about the same discipline as the one this article asks for. Do not confuse the surface of a story with the structural position that produces value.
Which falsifier would you watch first, and why?

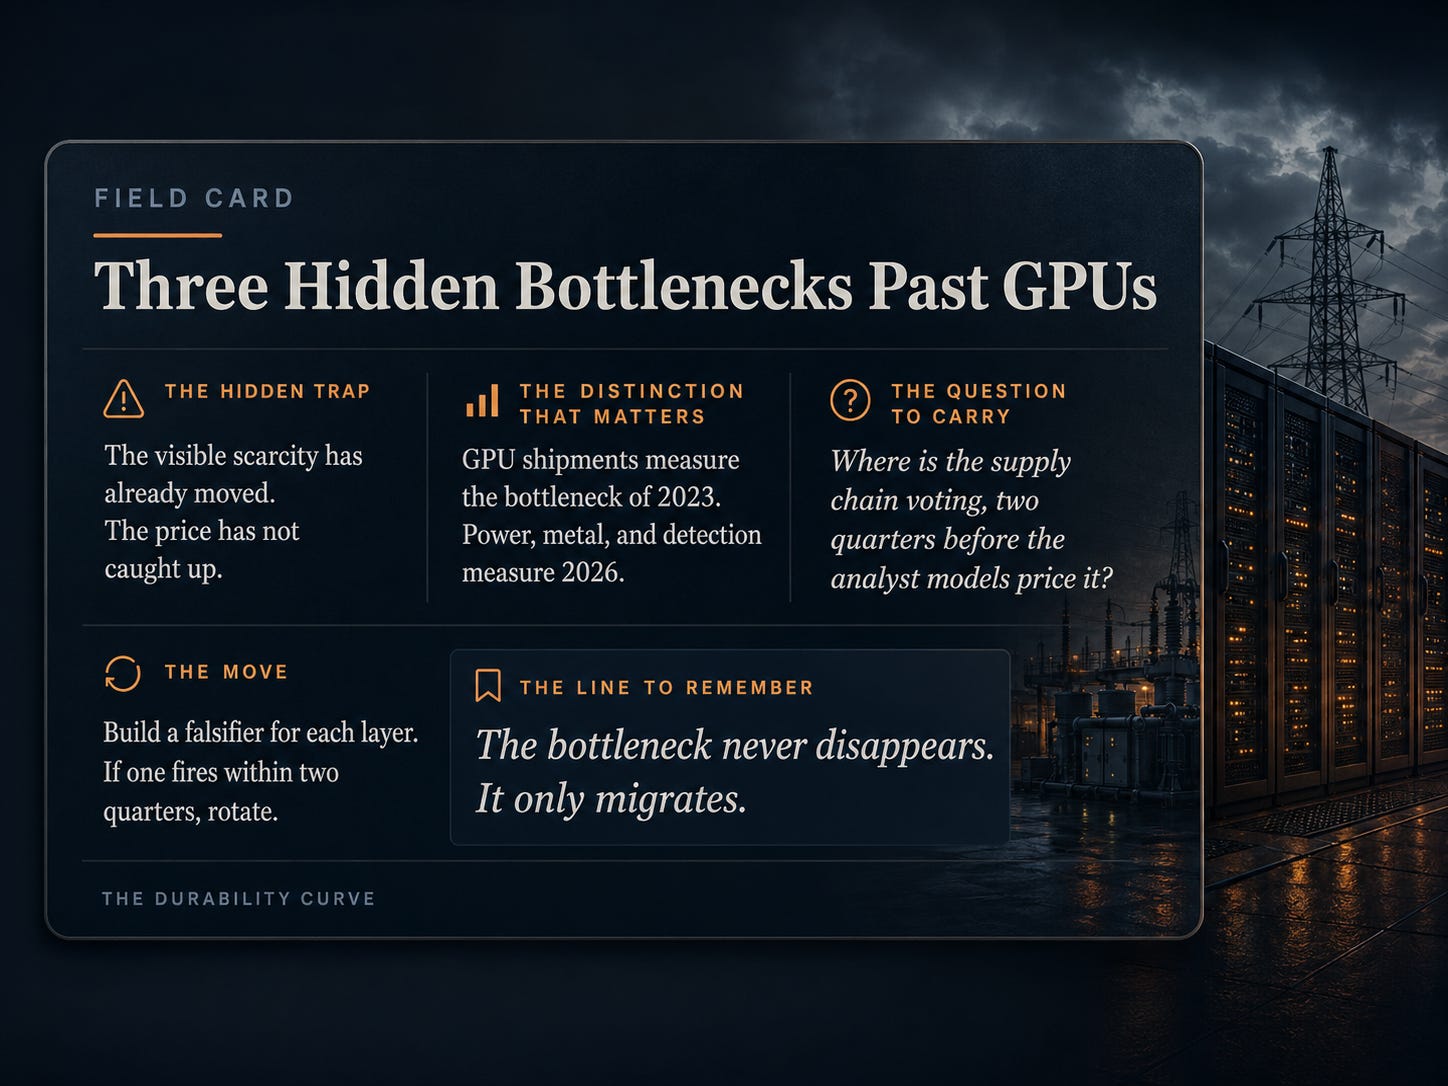
Field Card
Bloom Energy Q1 2026 SEC 8-K: revenue $751.1M (+130.4% YoY), FY26 guide raised to $3.4 to $3.8B. https://www.sec.gov/Archives/edgar/data/1664703/000162828026027913/ex991_q126financialresults.htm
Wood Mackenzie Q2 2025 industry survey: standard power transformers averaging 128 weeks lead time, generator step-up units 144 weeks, specialised orders out to four years. https://www.industrialsage.com/power-transformer-lead-times-us-grid-shortage/ and https://www.powermag.com/transformers-in-2026-shortage-scramble-or-self-inflicted-crisis/
Cleveland-Cliffs Butler Works is the sole US producer of grain-oriented electrical steel for transformer cores. https://www.clevelandcliffs.com/operations/steel-mills
Lawrence Berkeley National Laboratory, “Queued Up: 2025 Edition”: median interconnection-to-commercial-operation has doubled to over four years; ~10,300 active projects representing 1,400 GW generation and 890 GW storage as of end-2024. https://emp.lbl.gov/publications/queued-2025-edition-characteristics
S&P Global puts AI data-centre copper intensity at 30 to 47 tonnes per MW of IT capacity; JPMorgan industrial-metals coverage cites 47 tonnes per MW. https://skillings.net/copper-demand-ai-data-centers-vs-evs-the-2026-supply-shock-explained/ and https://skillings.net/copper-demand-ai-data-centers-2026-outlook-and-price-drivers/
S&P Global, “Navigating the US data center power crunch”: ~85 GW of new data-centre capacity pipeline by 2030 against current peak surplus generating capacity of ~70 GW. https://www.spglobal.com/en/research-insights/special-reports/look-forward/data-center-frontiers/navigating-us-data-center-energy-demand
JLL Global Data Center Outlook 2026: ~97 GW added globally between 2026 and 2030; ~35 GW under construction across North America. https://www.jll.com/content/dam/jllcom/en/global/documents/reports/research-reports/26-research-global-data-center-outlook-new.pdf
Wood Mackenzie, “High-wire act”: data-centre grid copper demand reaches 1.1 Mt/yr by 2030. https://www.woodmac.com/horizons/soaring-copper-demand-obstacle-to-future-growth/
BloombergNEF projects AI on-site copper demand averaging ~400 kt/yr over the next decade and peaking near 572 kt in 2028. The BNEF report is paywalled; figures quoted in https://carboncredits.com/data-centers-copper-hunger-how-ai-is-driving-a-looming-supply-crunch/ and https://globaltacticalmetals.com/ai-data-centers-to-worsen-copper-shortage-bnef/
ICSG World Copper Factbook 2025: 2024 global mine production ~23 Mt; refined production 27.5 Mt, of which 4.7 Mt secondary. https://icsg.org/download/2025-10-the-world-copper-factbook/
Aurubis AG (XETRA: NDA) ~0.4x trailing price-to-sales as of May 2026. https://www.morningstar.com/stocks/xetr/nda/valuation
MDA SHIELD IDIQ: $151B shared ceiling over ten years; 2,440 qualified vendors across three tranches (1,014 on 2 Dec 2025, 1,086 on 18 Dec 2025, 340 on 15 Jan 2026). https://www.defenseone.com/business/2025/12/gargantuan-golden-dome-contract-vehicle-clears-1000-plus-firms-vie-slices-151-billion/409900/ and https://dsm.forecastinternational.com/2026/01/16/pentagon-mobilizes-industrial-base-for-golden-dome-missile-shield-with-151b-shield-award/
Pentagon ten-year Golden Dome estimate ~$185B (Gen. Michael Guetlein, April 2026 testimony). CBO May 2026 analysis: up to $1.2T over twenty years with a full space-based interceptor layer (~70% of acquisition cost); ~$448B without it. https://spacenews.com/congressional-budget-office-estimates-1-2-trillion-price-tag-for-golden-dome/ and https://www.airandspaceforces.com/pentagon-cbo-trillion-dollar-golden-dome-estimate/
Spire Global (NYSE: SPIR) market cap ~$700M as of May 2026. https://companiesmarketcap.com/spire-global/marketcap/
Spire Global Q3 2025: remaining-performance-obligations $223.1M as of 30 Sept 2025 (over 3x TTM revenue); ~$70M expected to convert in 2026. https://ir.spire.com/news-events/press-releases/detail/279/spire-global-announces-third-quarter-2025-results